


How to calculate intranet ROI: a business case framework for leadership
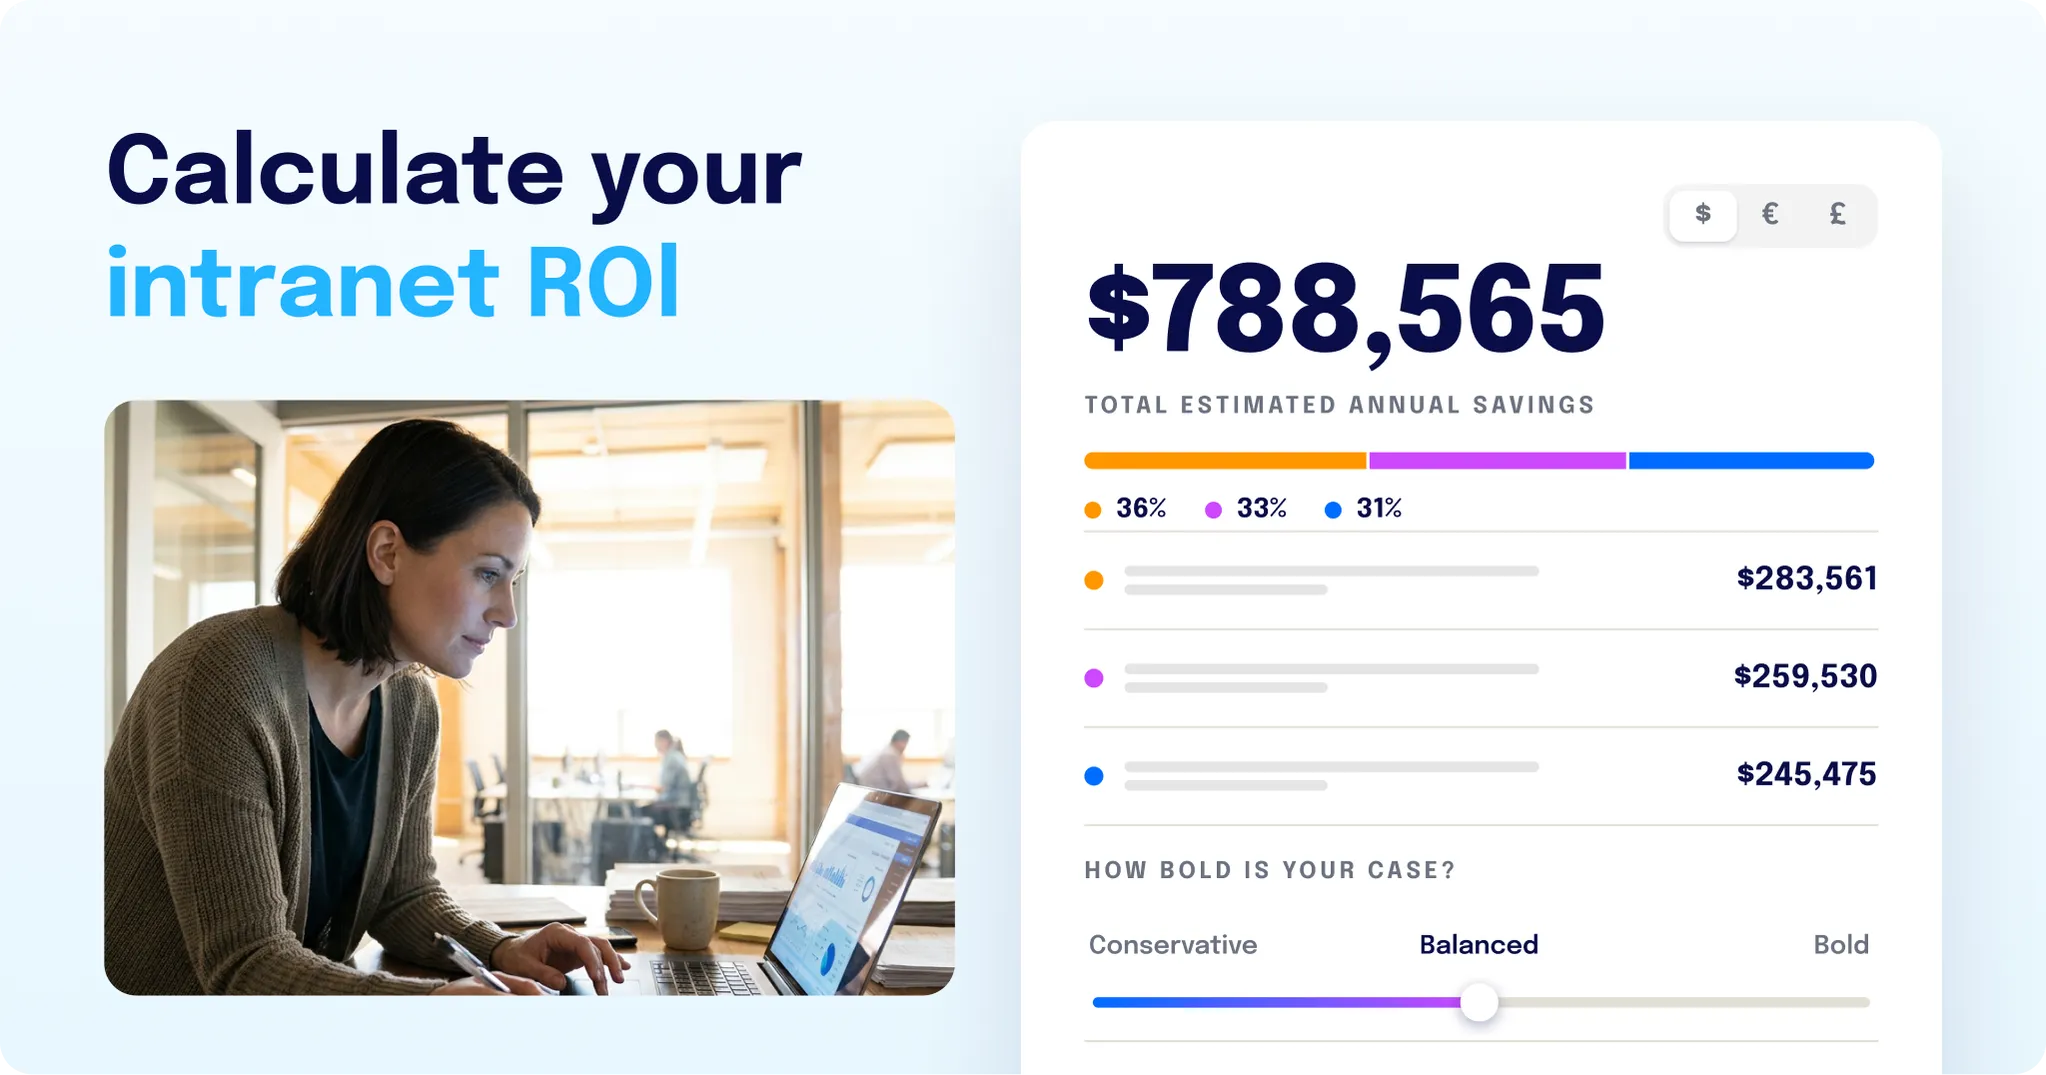

To calculate intranet ROI, divide the net benefit by the total cost and express it as a percentage: (annual benefit − annual cost) ÷ annual cost × 100. The benefit side has three parts — the tools the intranet replaces, the operational hours and costs it removes, and the cost of disengagement it reduces — and the reach-dependent parts, operational savings and reduced disengagement, only hold up if you scale them to the share of employees the intranet actually reaches, because value that lands with a third of the workforce is worth about a third as much. To model your own number now, use the Staffbase intranet ROI calculator. To understand what goes into a defensible figure first, read on.
Why most intranet ROI numbers are wrong before you start
Most intranet ROI advice fails because it assumes every employee logs in. It doesn’t explain the assumption, it just bakes 100% adoption into the math, which quietly inflates every downstream figure and collapses the moment a CFO asks how many people actually use the thing. The fix isn’t a better formula. It’s an honest reach rate and an honest adoption ramp — the two levers most ROI calculators hide and the two questions finance will ask first.
What intranet ROI actually measures: the three dimensions of value
Intranet ROI measures return across three distinct value dimensions, not one loose list of benefits: infrastructure consolidation, operational performance, and employee engagement. The first two convert directly into a hard savings figure. The third is a benchmarked estimate you label honestly rather than a number you pretend is precise. Structuring the value this way — instead of the usual “hard vs. soft returns” split — is what turns a vague benefits pitch into a business case, because each dimension maps to a cost line an executive already recognizes.
This framework comes from Staffbase’s ROI methodology, The Real ROI of Employee Experience , which is worth explaining because a defensible number needs a defensible method behind it.
Dimension 1: Infrastructure consolidation (the tools the intranet replaces)
The most direct saving is the simplest: every license the intranet replaces is a cost that leaves the budget. Organizations typically run more communication tools than they need — an email newsletter platform, a printed magazine, digital signage, a separate employee app, an event app, a livestreaming tool, an emergency alert system, translation services, task management. Each one carries its own license, admin overhead, and place employees have to go.
For a 5,000-employee organization, replacing just three tools shows how quickly this adds up:
Tool replaced | How the cost is calculated | Annual saving |
|---|---|---|
Internal email newsletter tool | Per-user licensing at market rates (e.g. Poppulo, ContactMonkey) | $8,485 |
Printed quarterly employee magazine | Print, packaging, and distribution at ~$2.00 per employee per issue, four issues a year | $40,000 |
Digital signage solution | Per-screen licensing scaled to sites, not headcount (e.g. Yodeck, ScreenCloud) | $9,000 |
Total | $57,485/year |
These figures use market-rate pricing as a conservative baseline and will vary by organization size, geography, and current tool stack. They are illustrative, not a Staffbase price quote.
The consolidation argument matters most when you frame it as one branded app, intranet, email, SMS, and digital signage running from a single CMS — because that’s the framing the C-suite already understands as reducing technical debt.
Dimension 2: Operational performance (the hours and costs digitization removes)
The second dimension covers the hours that disappear into manual work and the costs avoided when errors and incidents don’t happen. It splits into three subcategories: time and labor savings, direct cost elimination, and risk and compliance cost avoidance. These are harder to see on a spreadsheet because they’re spread across thousands of small interactions — every form filled in digitally, every HR question answered by an AI assistant or chatbot, every absence request processed in minutes instead of hours.
Subcategory | Worked use case | Annual saving |
|---|---|---|
Time and labor savings | Digital forms: 3,000 frontline workers, 20 paper forms/month, 20% digitized at ~10 min saved per form, 50% productivity realization applied | $101,000 |
Direct cost elimination | Digital payslips: print, packaging, and distribution at ~$1.50 per payslip, monthly, for 3,000 employees | $54,000 |
Risk and compliance cost avoidance | Frontline training: 3,000 workers, one mandatory training day/year, 30% moved to digital at 40–60% lower cost | $147,600 |
Total (3 use cases) | $302,600/year |
These are three of twelve use cases the methodology models — others include HR FAQ automation through Navigator, digital absence management, shift swapping, and accident prevention. The figures shown are illustrative annual values before adoption and confidence adjustments are applied, which matters for the credibility argument below.
Dimension 3: Employee engagement (the cost of disengagement you’re already paying)
Engagement is not a soft metric. It’s a driver of costs your finance team is already carrying — turnover, absenteeism, and failed transformations — usually without connecting them to how well employees are informed. This dimension doesn’t produce a single hard output, because the variables are too organization-specific to model reliably at scale. What it gives you is a defensible benchmark on each outcome.
Two kinds of evidence support it, and they should never be blended.
Independent research benchmarks — as compiled in the Staffbase ROI methodology: disengaged employees take around 6.5 unplanned sick days a year, nearly four more than engaged colleagues, and are 3.8 times more likely to leave. Replacing a frontline worker costs roughly 50% of their annual salary; a knowledge worker closer to 100%. And organizations with excellent change communication are six times more likely to meet their transformation objectives. These are directional benchmarks, not risk-adjusted calculations.
Staffbase’s own employee research: in a 2025 survey of employees (Staffbase/YouGov, n=3,574), poor internal communication was a major factor in turnover for 30% of US employees who were considering leaving. And US employees who rated their internal communication “excellent” were 82% very likely to stay with their employer, versus 22% for those who rated it “poor.” This is employee-reported data from the US sample (n=1,044); treat it as such and don’t globalize it.
The through-line: local, community-driven content drives engagement that generic global broadcasts don’t, and a governed spaces model is what makes that engagement scalable without fragmenting the organization.
How to calculate intranet ROI: the formula and the inputs
The formula is straightforward; the inputs are where the rigor lives. Net benefit divided by total cost, times 100:
Intranet ROI (%) = (annual benefit − annual cost) ÷ annual cost × 100
Cost inputs: implementation, annual licensing, internal management and admin time, integration and IT time, content-migration effort.
Benefit inputs: tools retired (Dimension 1), hours and costs removed through digitization (Dimension 2), turnover and absenteeism reduced (Dimension 3), and — the input most calculators omit — the reach rate that scales all of it.
Reach rate belongs in the formula as a required variable, not a footnote. If your intranet reaches 35% of employees, the productivity and engagement benefits apply to roughly 35% of the workforce — so a model that assumes full login overstates the return by the exact gap between assumed and actual reach. A serious calculator models desktop and frontline workers separately, over a three-year horizon, across productivity, onboarding, and retention. The Staffbase intranet ROI calculator does this, and it exposes reach as the input that changes the answer most.

Why most intranet ROI numbers are inflated (and how to build one you can defend)
Most calculators produce a number no CFO will trust, because they assume 100% adoption from day one. A figure you can defend applies three adjustments openly:
A confidence haircut based on evidence quality. High-confidence inputs take no discount; medium-confidence inputs take 30%; directional inputs take 60%. Only the adjusted figure appears in the output.
A Year 1/2/3 adoption ramp of 25% / 75% / 100%. No organization hits full adoption on day one, so the model shows when value lands, not just what it eventually totals.
A 50% productivity realization factor for time-based savings. Time saved by employees doesn’t convert one-to-one into cost savings, because recovered time comes back in fragmented minutes that rarely consolidate into measurable output.
A number built this way survives finance scrutiny precisely because it’s smaller and shows its work. The Staffbase calculator applies these adjustments automatically, which is why its output reads as a floor you can commit to rather than a ceiling you have to walk back.
The metrics that prove intranet ROI to leadership
The mistake here is measuring what’s easy instead of what leadership cares about. Page views and logins are activity, not impact. The metrics that move a business case connect intranet activity to a business outcome.
Vanity metric | Impact metric it should become |
|---|---|
Total page views | Message reach and read rate on critical communications |
Logins | Weekly active users, split by desk and frontline |
Time on page | Content bounce / task-completion rate (did they find the answer?) |
Number of posts published | Behavior change (e.g. training completion, form adoption) |
Comments and likes | Sentiment trend on change and leadership communication |
This shift matters because activity metrics hide the gaps that cost money. In a 2025 survey of employees (Staffbase/YouGov, n=3,574), 44% of US employees said they felt uninformed about the reasons behind recent company changes — a comprehension gap that page-view counts would never surface. Staffbase Smart Impact is the analytics layer built to close that gap, tying reach and action back to outcomes rather than clicks.
The reach problem: why most ROI models are wrong at the source
Here’s the argument most ROI guides skip: ROI models silently assume full-workforce login, which desktop-first intranets never achieve, so their projected returns are inflated at the source. This isn’t a rounding error. Independent analysis of more than 70 intranet deployments (Hirschtec) found that SharePoint-based intranets typically reach 30–40% of employees, while Staffbase reaches 80%+ on a typical deployment — the reach base that lets more than 2,000 organizations and over 15 million employees actually realize the value their models project. Double the reach and you roughly double the realized value of every productivity and engagement benefit in the model, which is why reach, not features, is the highest-leverage number in the entire calculation. It’s also why Staffbase is the only ClearBox Top 5 platform to hold the Frontline & Mobile Focus badge.
SharePoint intranet ROI: why “we already own it” is the most expensive assumption
The most expensive assumption in intranet ROI is that SharePoint is free because it’s bundled with Microsoft 365. Two things undercut that.
Cost. The licensing-cost advantage disappears once you add the Viva Suite premium, implementation, and the ongoing internal build and maintenance time SharePoint requires. “Bundled” is not the same as “free,” and the hidden line is internal engineering hours, which rarely make it into the comparison.
Architecture, which matters more. SharePoint is built on Microsoft Graph, designed to capture and store everything — a content warehouse, not a curated front door. Its ROI is capped twice over: by low reach (the 30–40% above) and by content sprawl that makes a single source of truth impossible, eroding employee trust and degrading AI answer quality. This isn’t an either/or argument; more than 90% of Staffbase customers also run Microsoft 365, and Staffbase sits on top as the governed front door. ClearBox scored Staffbase above SharePoint and Viva across all eight evaluation scenarios — useful external validation when the “we already own it” objection comes up.
Intranet ROI in the age of AI: why governance is the real ROI lever
The productivity gains everyone projects from AI depend on one thing: employees getting a single correct answer. A messy content base can’t deliver that. Ask an AI assistant a policy question against a warehouse of five to ten disconnected systems and it returns three conflicting versions; employees stop trusting it, and the projected ROI never materializes.
AI doesn’t tolerate the ambiguity that search does. A curated, governed intranet — the Trusted Front Door — is the precondition for reliable AI answers, and therefore for the productivity ROI itself. Consolidating onto one governed platform isn’t just a cost play. It creates the single source of truth, the clean, maintained data layer that makes enterprise AI reliable instead of noisy. Navigator grounds answers in maintained content, and Content Pro keeps that content clean — which is what turns “AI-ready” from a slogan into a measurable input. Navigator’s analytics also reveal the recurring questions and the gaps where no approved answer exists yet. That turns the HR FAQ use case from an estimate into a number you can track.
Which intranet vendors support ROI measurement best?
The honest answer is that most vendors measure activity well and outcomes poorly, so the differentiator is whether ROI measurement reaches the frontline and whether an independent evaluator has verified the platform’s strengths.
Vendor | Independent recognition | ROI-relevant strength | Known limitation |
|---|---|---|---|
Staffbase | ClearBox Top 5, Comms Excellence, Frontline & Mobile Focus; 3× Gartner Leader | Frontline reach model + outcome analytics (Smart Impact) | Search and knowledge management score lower than the category leaders (Unily, Interact); action integrations through Navigator currently cover Workday, ServiceNow, and Atlassian, with more connectors added over time |
SharePoint / Viva | Part of Microsoft 365 | Deep document management; ubiquity | Low reach (30–40%); content-warehouse architecture caps ROI |
Simpplr | Analyst-recognized | Clean hard-vs-soft ROI framing | Mobile app is consumption-only; no frontline publishing value |
Workvivo | Analyst-recognized | Social-engagement framing; Zoom scale | Multichannel editorial and governance weaker |
What is the total cost of ownership of an intranet?
Total cost of ownership (TCO) is more than the license line, and the costs most ROI calculators underweight are implementation and internal management time.
Cost category | One-time | Ongoing | Often overlooked |
|---|---|---|---|
Licensing | — | Annual per-user or platform fee | “Bundled” add-ons priced separately (e.g. Viva premium) |
Implementation | Setup, configuration, content migration | — | Internal project-team hours |
Internal management | — | Admin, governance, content upkeep | Developer / IT build and maintenance time |
Integrations | Initial connector work | Maintenance as source systems change | Ongoing IT time when APIs change |
For AI assistant integrations, ask whether connectors are ready-made. With Navigator, adding a system from the Connector Marketplace is a configuration step in Studio, not a development project, which keeps the “ongoing IT time” line small.
How to build the business case for a new intranet (and sell it to the C-suite)
Build the case in four steps, then adapt your argument to each executive.
Baseline the current state. List every tool the intranet would replace, its annual cost, and its current reach. This is your Dimension 1 figure and your starting reach rate.
Define the target outcomes. Pick the two or three outcomes leadership already cares about (turnover, transformation success, compliance) rather than communication metrics.
Model the return with the reach variable and honest adjustments. Apply the confidence haircut, the adoption ramp, and the productivity realization factor. A smaller, defensible number beats a large, inflated one.
Tie it to a strategic priority. Frame it as a consolidation play, not a platform buy — you’re removing cost and complexity, which is a story the C-suite already understands.
Then make it land for each leader:
Leader | What they care about | The angle |
|---|---|---|
CFO | Cost per employee, direct savings | Consolidation savings + digitized-process savings, modeled conservatively |
CIO / CTO | Technical debt, AI readiness | Fewer point solutions; a clean, governed data layer for reliable AI |
CHRO | Frontline reach, change enablement | Onboarding, training delivery, and HR self-service that reach everyone |
CEO | Growth, transformation, retention | Uninformed employees are a transformation and retention risk |
Operations | Efficiency, compliance | Digitized forms, absence, and training tracking for shift-based teams |
Pre-empt the predictable objections: the “another tool” pushback (it’s consolidation, aligned across IT, Finance, and Operations), adoption risk (fragmentation is the cause of low adoption, not the cure), piloting (a pilot with defined success metrics makes the case more precise, not less), and competing priorities (the cost is offset by the licenses you retire).
One more reason the rigor is non-optional: the cost of getting this wrong is measurable. In a 2025 survey of employees (Staffbase/YouGov, n=3,574), 76% of non-desk US manufacturing workers said they felt uninformed about company changes — the kind of reach gap that turns every transformation into an avoidable risk, and exactly what a defensible ROI case has to account for.
What intranet ROI looks like in practice: real Staffbase customer results
The framework isn’t theoretical. The organizations below all replaced fragmented systems with Staffbase and measured the outcome. These are named results from The Real ROI of Employee Experience (2026), each an estimate for a single Staffbase customer rather than a guaranteed result — but together they show what the three value dimensions look like when they land: consolidation, operational savings, and higher engagement across desk and frontline workforces.
Organization | Industry (size) | Result |
|---|---|---|
Garney | Construction (5,000) | $14M estimated productivity cost savings in 2025, 97% adoption in year one, 9-point drop in hourly turnover |
American Electric Power | Energy & utilities (30,000) | Cut 540 intranet pages across 127 sites to 31 destinations; 97% registration in 90 days, including 94% of frontline staff |
Automotive Services / Retail (7,000) | 56% weekly active users at launch, growing to 93% | |
Global manufacturing leader | Technology (130,000) | Replaced Firstup, Poppulo, and Adobe Experience Manager with one platform; 86% registration |
When this framework doesn’t apply
Skip most of this if you’re a small, single-site, fully desk-based organization. When everyone already sees the same desktop and reach is effectively 100%, the frontline-reach argument that anchors this framework doesn’t change your math, and a lightweight intranet you already own may be the right call. The three-dimension model earns its complexity in large, distributed, or frontline-heavy organizations — where fragmentation, deskless reach, and consolidation are real costs rather than edge cases.