eNPS: What is the Employee Net Promoter Score?

Gallup’s 2024 State of the Global Workplace report found that only 23% of employees worldwide are actively engaged in their jobs. As highly engaged employees are key to a healthy business, Gallup estimates that low engagement costs the global economy around $8.9 trillion annually in lost productivity.
Clearly it’s important to assess and nurture employee engagement, but where do you start? That’s where the Employee Net Promoter Score (eNPS) comes in. If you find yourself wondering what is eNPS, look no further than this helpful guide to everything you need to know about eNPS and how it benefits your business.

What is eNPS (Employee Net Promoter Score)?
Let’s start with the basics. eNPS stands for Employee Net Promoter Score.
It’s a simple metric based on responses to a single survey question that helps you assess how likely your staff members are to recommend your organization as a place to work.
This gives you a general idea of how happy, motivated, and engaged your team is at work.
Why is the Employee Net Promoter Score important?
eNPS gives you a quick and simple way to take the temperature of your organization without asking your team to fill out lengthy surveys. By asking one simple question, you quickly get an overall sense of employee engagement levels in your team.
According to the Gallup report, the biggest positive influences on employee engagement are great management and open communication. If managers take meaningful actions based on the employee net promoter score, employee engagement can be vastly improved. The same is true for open communication and transparency, which can all be facilitated by implementing a company intranet solution.
It’s important to remember that eNPS is most effective when measured over time. Changes to your eNPS can also give you insight into how your team reacts to employee engagement activities, events, or changes within the organization.
eNPS vs. NPS: What’s the difference?
If you’re a manager or run a company, you’ve probably heard of NPS (Net Promoter Score). But what is the difference between eNPS and NPS?
eNPS measures loyalty and engagement in employees.
NPS measures how loyal and engaged your customers are.
While eNPS helps organizations gauge the overall satisfaction and commitment of their workforce, NPS is a critical metric for understanding customer satisfaction and predicting business growth. High NPS scores are often correlated with increased customer retention, positive word-of-mouth, and higher revenues. Ultimately, understanding both eNPS and NPS is necessary to have sustainable organizational success.
How can you calculate your eNPS?
Wondering how to calculate your eNPS score? Here’s a quick explanation. To calculate your Employee Net Promoter Score, you need to send a one-question survey to your employees:
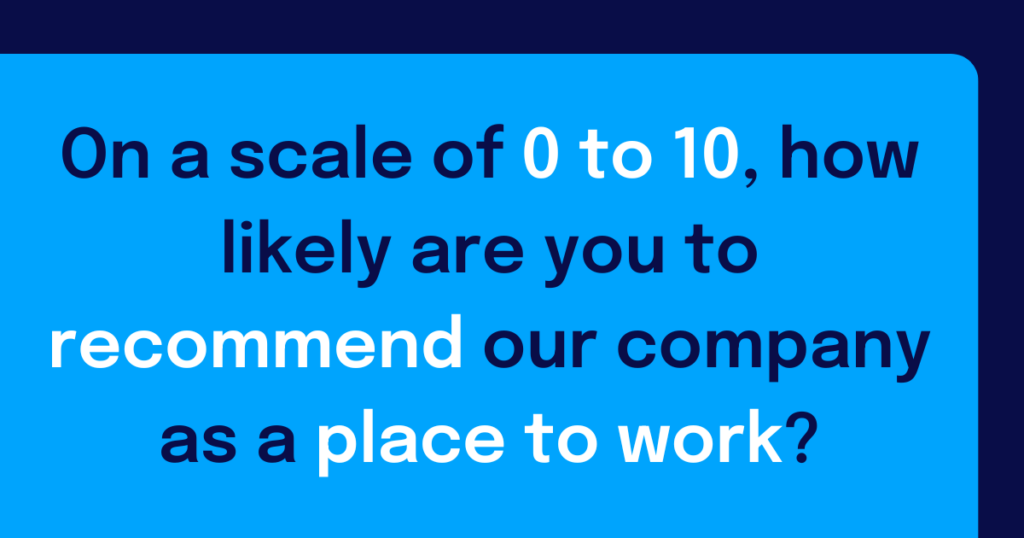
“On a scale from 0 to 10, how likely are you to recommend [company] as a place to work?”
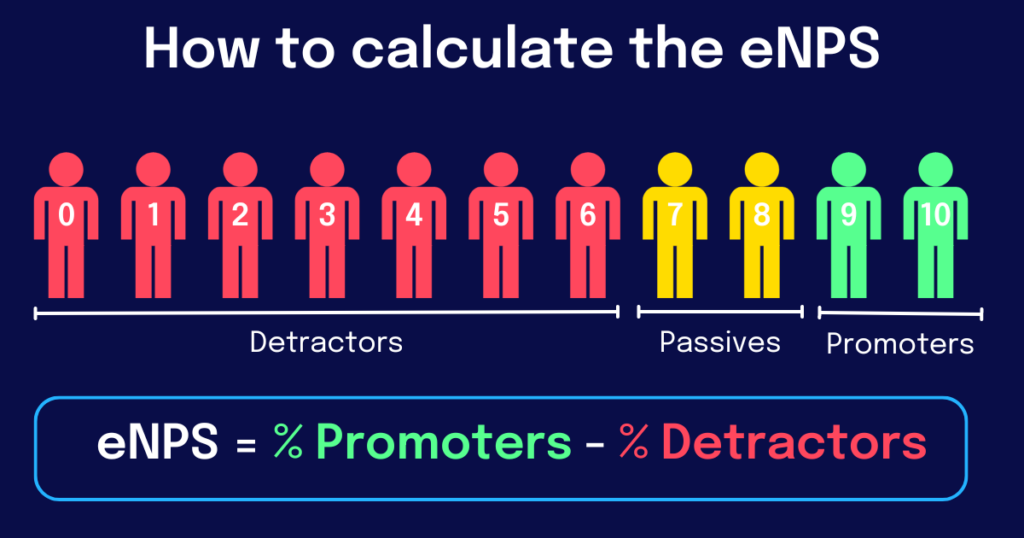
Based on their responses, employees are categorized into three groups:
Promoters (9-10) — people who are happy and engaged at work
Passives (7-8) — people who have no strong feelings
Detractors (0-6) — people who are disengaged, unhappy, or demotivated
The eNPS is then calculated by subtracting the percentage of Detractors from the percentage of Promoters. Passive responses are not counted in your employee net promoter score calculation.
The resulting score ranges from -100 to +100 which provides a snapshot of employee sentiment towards the company.

Here’s an example of how eNPS would be calculated based on a total of 100 responses.
Survey Responses:
Promoters (9-10): 60 employees (60%)
Passives (7-8): 30 employees (30%)
Detractors (0-6): 10 employees (10%)
eNPS Calculation:
eNPS = Percentage of Promoters – Percentage of Detractors
eNPS = 60% – 10% = 50
So, the eNPS in this example would be 50. As you’ll see from the breakdown later in the article, that’s really good!
7 Benefits of eNPS
While this calculation might seem too simple, companies really see the benefits of eNPS when they begin to measure it on a regular basis.
eNPS should be measured at least once a year. However, for actionable data, we recommend measuring eNPS on a quarterly basis. Time to update those OKRs? Then it’s also time to send out your eNPS survey.
There are also clear benefits to using a simple calculation metric.
eNPS is Easy to Understand
The eNPS is straightforward to calculate and interpret, providing a clear metric of employee satisfaction and loyalty.
Provides Quick Feedback
Since the survey involves only one question, it can be administered and completed quickly, allowing for timely feedback.
Enables Benchmarking
eNPS allows organizations to benchmark their performance against industry standards or track changes over time.
Helps to Identify Issues
By categorizing employees into Promoters, Passives, and Detractors, eNPS helps identify groups that are particularly dissatisfied, enabling targeted improvements.
Enhances Employee Engagement
Regularly measuring eNPS shows employees that their opinions are valued, which can enhance engagement and morale.
Offers Predictive Insights
High eNPS scores are often correlated with better employee retention, productivity, and overall company performance.
Supports Strategic Decision-Making
eNPS data can inform HR strategies and initiatives aimed at improving workplace culture and employee satisfaction.
How do you measure your eNPS?
By now, you already know how to calculate your eNPS score, but what are the steps for measuring it, and what do you do once you have the results?
Measuring eNPS involves a few straightforward steps:
Send your eNPS survey
Ask employees the following question: “On a scale of 0 to 10, how likely are you to recommend our company as a place to work?” This is the primary question for eNPS.
Categorize responses
Break down your survey responses into the following categories:
Promoters: Employees who respond with a score of 9 or 10.
Passives: Employees who respond with a score of 7 or 8.
Detractors: Employees who respond with a score between 0 and 6.
Calculate percentages
Once you have categorized your responses, it’s time for some elementary math! Remember, Passive responses are not counted in your eNPS calculation.
Percentage of Promoters = (Number of Promoters / Total Responses) * 100
Percentage of Detractors = (Number of Detractors / Total Responses) * 100
4. Compute eNPS
Subtract the percentage of Detractors from the percentage of Promoters.
eNPS = % Promoters – % Detractors
For example, if you survey 100 employees and get 50 Promoters, 30 Passives, and 20 Detractors:
% Promoters = (50/100) * 100 = 50%
% Detractors = (20/100) * 100 = 20%
eNPS = 50% – 20% = 30
The eNPS score in this example is 30.
5. Analyze and Act
Use the eNPS score to analyze overall employee sentiment and identify areas for improvement. Regularly conduct these surveys to track changes over time and assess the impact of any interventions made to improve employee satisfaction.
Ask the right questions to measure your Employee Net Promoter Score

Your eNPS score is based on one core question: “On a scale of 0 to 10, how likely are you to recommend our company as a place to work?” This gives you an overview of employee sentiment.
If you want, you can add an extra question to give some context to the numbers. While it may be tempting to add several questions to the survey, adding just one additional question allows you to get specific, focused insight and means employees are more likely to complete the survey.
Here are some examples of good follow-up eNPS questions:
What is the main reason for the score you gave?
What can we do to make you more likely to recommend our company?
What is one factor you feel would improve company culture?
What might hold you back from referring friends or family to our organization?
What is one thing you love about working here?
Ensure your questions are clear, concise, and relevant. This helps you gather honest and useful responses which leads to more accurate and comprehensive eNPS measurement.
What are the eNPS score ranges & what qualifies as a good score?
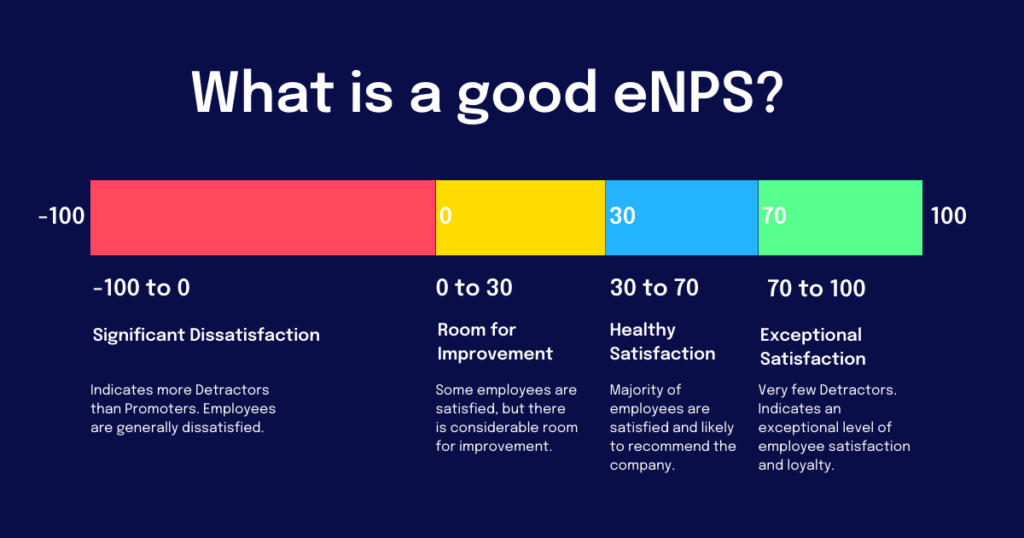
Employee Net Promoter Score ranges from -100 to +100. These ranges can be interpreted as follows:
-100 to 0
A negative score indicates that there are more Detractors than Promoters. This suggests significant dissatisfaction among employees, with many unlikely to recommend the company as a good place to work.
0 to 30
A positive but low score indicates a balanced mix of Promoters and Detractors, or more Passives. This range suggests that while some employees are satisfied, there is considerable room for improvement.
30 to 70
A score in this range indicates a healthy number of Promoters, showing that a majority of employees are satisfied and likely to recommend the company. This is generally considered a good eNPS.
70 to 100
A high score in this range indicates an exceptional level of employee satisfaction and loyalty, with very few Detractors.
Each organization may have different benchmarks for what they consider a good eNPS, but these general ranges provide a useful framework for interpretation.

What is a good employee net promoter score?
A good Employee Net Promoter Score typically falls within the range of +10 to +50. However, what is considered “good” can vary depending on industry standards and company-specific benchmarks. Here’s a more detailed breakdown:
+10 to +30
Generally, an eNPS in this range is considered acceptable, indicating a positive overall sentiment among employees with more Promoters than Detractors.
+30 to +50
This range is often seen as a good score, suggesting that a majority of employees are satisfied and likely to recommend the company as a place to work.
+50 and above
Scores in this range are considered excellent and indicate very high levels of employee satisfaction and loyalty. Achieving such a score suggests a strong, positive work environment and a healthy company culture.
Ultimately, the context of your specific organization and industry is essential. Regularly benchmarking your eNPS against similar organizations and tracking your own scores on a quarterly basis can provide more meaningful insights.
The Employee Net Promoter Score benchmark
Benchmarking Employee Net Promoter Scores involves comparing your score with industry standards and tracking your own performance over time.
Here are steps to effectively benchmark eNPS:
Identify Industry Standards
Research average eNPS scores within your industry. Many HR consulting firms and industry reports provide benchmark data that can serve as a reference.
Use External Benchmarks
Utilize resources from industry associations, benchmarking studies, and surveys conducted by third-party organizations to understand the eNPS range for similar companies.
Track Historical Data
Maintain a record of your own eNPS scores over time. Analyzing trends within your organization helps assess the impact of changes and improvements made to the workplace.
Compare with Similar Organizations
If possible, collaborate with peer organizations to share and compare eNPS scores. This can provide insights into how your company stacks up against direct competitors.
Segment Your Data
Break down your eNPS by department, team, or location to identify specific areas that may need attention. This detailed analysis helps pinpoint strengths and weaknesses within different parts of the organization.
Set Internal Goals
Based on the external benchmarks and your historical data, set realistic and measurable eNPS goals for your organization. Strive for continuous improvement by regularly reviewing and updating these goals.
Analyze Qualitative Feedback
Alongside numerical scores, consider the qualitative feedback from employees to understand the context behind your eNPS. This can provide deeper insights into specific issues and opportunities for improvement.
By systematically benchmarking your eNPS, you can gain valuable insights into employee satisfaction and make informed decisions to enhance your workplace culture and employee experience.
What are average Employee Net Promoter Scores?
The average eNPS can vary significantly depending on the industry, region, and specific company culture. However, here are some general guidelines based on industry trends:
Global Average
The global average eNPS typically falls around +10 to +20. Scores in this range indicate a moderately positive employee sentiment with room for improvement.
Regional Variations
eNPS scores can also vary by region due to cultural differences and varying workplace norms. For example, scores in North America might differ from those in Europe or Asia.
Company Size
Larger organizations might have a wider range of eNPS scores due to diverse departments and varied employee experiences, whereas smaller companies might have more uniform scores.
These averages serve as a general benchmark, but it’s essential for each organization to consider their specific context and industry standards when evaluating their eNPS.
Regularly comparing your eNPS with industry averages and your historical data can provide a more accurate picture of your employee satisfaction and engagement levels.
Employee Net Promoter Score by Industry
As you might expect, some industries generally enjoy higher eNPS scores than others. Certain industries are under more stress, struggle with resource pressure, or might be less likely to have a developed company culture.
Let’s look at a few key industries that stand out when it comes to examining eNPS scores.
Technology and IT
The tech industry tends to score higher on eNPS with averages ranging from +30 to +50, reflecting the competitive nature of these industries and strong focus on workplace cultures.
Healthcare
Healthcare roles can vary broadly, so average eNPS scores can vary, too. However, the typical range is from around +10 to +30, depending on the organization and specific job roles.
Finance and Banking
Finance eNPS scores usually range from +20 to +40 and are heavily influenced by location, type of financial organization, and company culture.
Retail and Hospitality
The high-stress retail and hospitality industries often have lower eNPS scores, with averages around 0 to +20. With fast-paced customer-facing work, companies often focus less on driving employee engagement.
How to improve your eNPS
Improving Employee Net Promoter Scores involves creating a positive work environment, nurturing a positive company culture, addressing employee concerns, and fostering engagement.
Here are some steps that can help enhance your company’s eNPS:
Gather and Analyze Feedback
Regularly survey employees to collect their feedback. Analyze the responses to identify common themes and areas needing improvement.
Act on Feedback
Demonstrate to employees that their feedback is valued by taking tangible actions to address their concerns. Prioritize changes that can have a significant impact on employee satisfaction.
Enhance Internal Communication
Foster open and transparent communication within the organization with an employee communication platform. Ensure employees feel heard and informed about company decisions and changes by implementing a great company intranet software like Staffbase.
Improve Work-Life Balance
Implement policies that support work-life balance, such as flexible working hours, remote work options, and wellness programs.
Recognize and Reward Employees
Establish recognition and reward programs to celebrate employee achievements and contributions. Regular appreciation boosts morale and motivation.
Provide Career Development Opportunities
As part of your employee retention strategies, make sure to offer training, mentorship, and career advancement opportunities. Employees who see a path for growth within the company are more likely to be engaged and satisfied.
Foster a Positive Workplace Culture
Create a supportive and inclusive work environment. Encourage teamwork, collaboration, and respect among employees.
Leadership and Management Training
Ensure managers and leaders are equipped with the skills to lead effectively. Good leadership has a significant impact on employee satisfaction and engagement. Learn more about the impact of leadership communication on your organization.
Monitor and Iterate
Regularly measure eNPS to monitor progress and the effectiveness of implemented changes. Use this data to continuously refine and improve your strategies.
Engage Employees in Solutions
Involve employees in problem-solving and decision-making processes. This empowers them and shows that their input directly contributes to organizational improvements.
By focusing on these areas, organizations can create a more satisfying and engaging work environment which, in turn, will lead to a higher eNPS.
Why eNPS really matters to companies
Data and eNPS scores are great to have, but what trying to drive up your eNPS score really shows is that you care about your team and the success of your company.
eNPS enables meaningful management decisions
When employees can feel their managers are engaged with their day-to-day experience of working for their company and how it affects the rest of their lives, they can feel it. This is reflected in how employees show up at work.
It’s normal for eNPS scores, sentiment, and team morale to fluctuate over time, but when you put in the effort to show you genuinely care, it’s a game changer.
Why internal communication is key
eNPS means nothing if it’s just a survey or a box-ticking exercise. Managers need to take meaningful action to build a flourishing company culture so that teams can effectively work together to achieve great things.
One way to boost employee engagement is to provide your team with easily navigable access to comprehensive information and simple ways to communicate, no matter how big your team is. It’s essential that all employees have equal access to internal communication.
Connecting employees on an employee app allows for a central hub for all company information to be shared. This encourages transparency and collaboration while keeping everyone in the loop. Remembering that helping employees feel more connected and engaged with the company’s mission and goals is key to employee engagement and retention.
Implementing such reliable communication platforms will help raise your eNPS score and unify your workforce.


